Reports & Analytics
The reporting layer: the attendance report with registers, trends and threshold alerts; the analytics workbench with drillable reports; application targets; and learner reporting extracts.
Demo sign-ins: demo.staff, demo.admin — shared password Demo@2026
How it flows
From register to intervention
1. Attendance Assurance Process
From a taken register to an honest at-risk list — and the trap of the register never taken.
Screen-by-screen
Attendance report
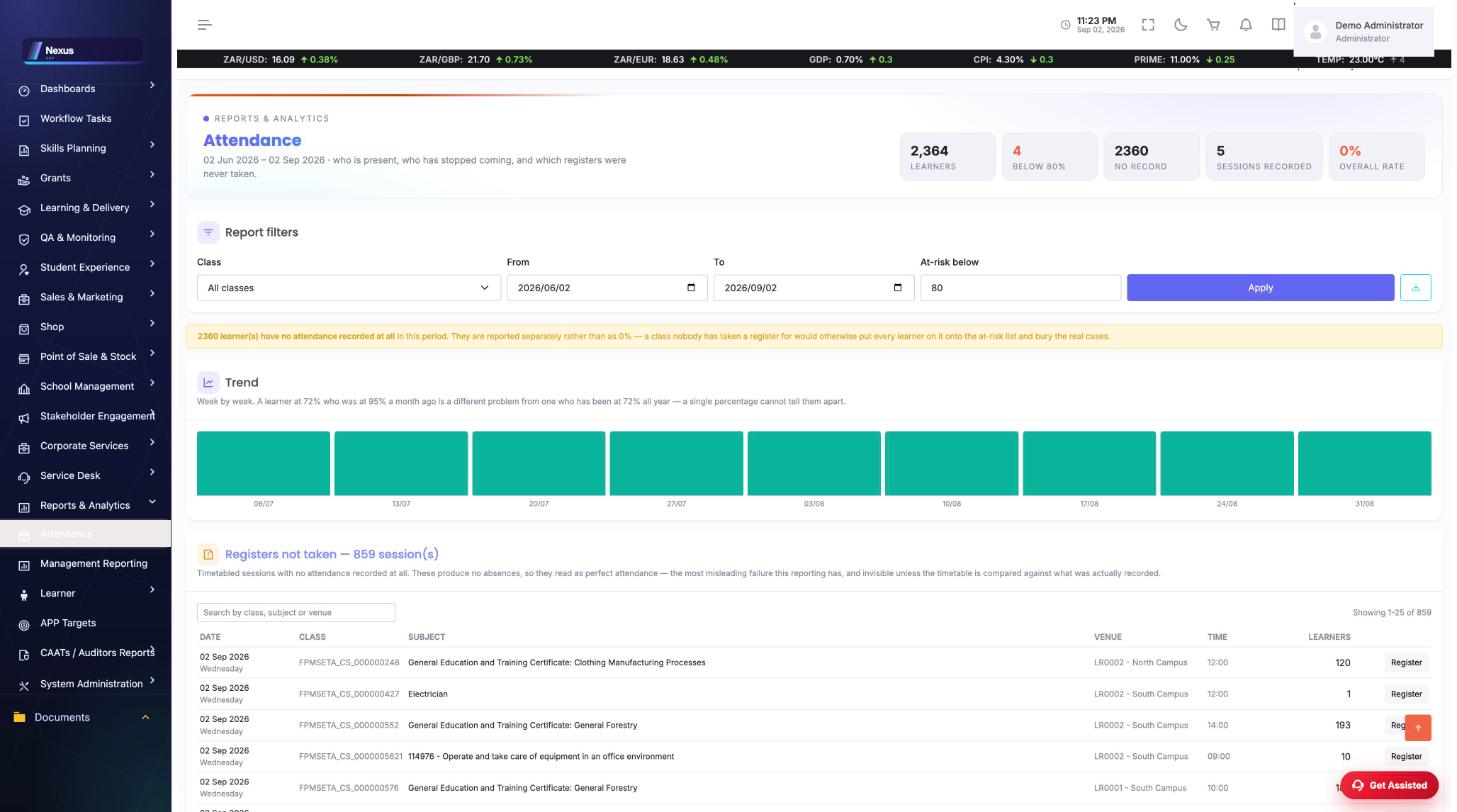
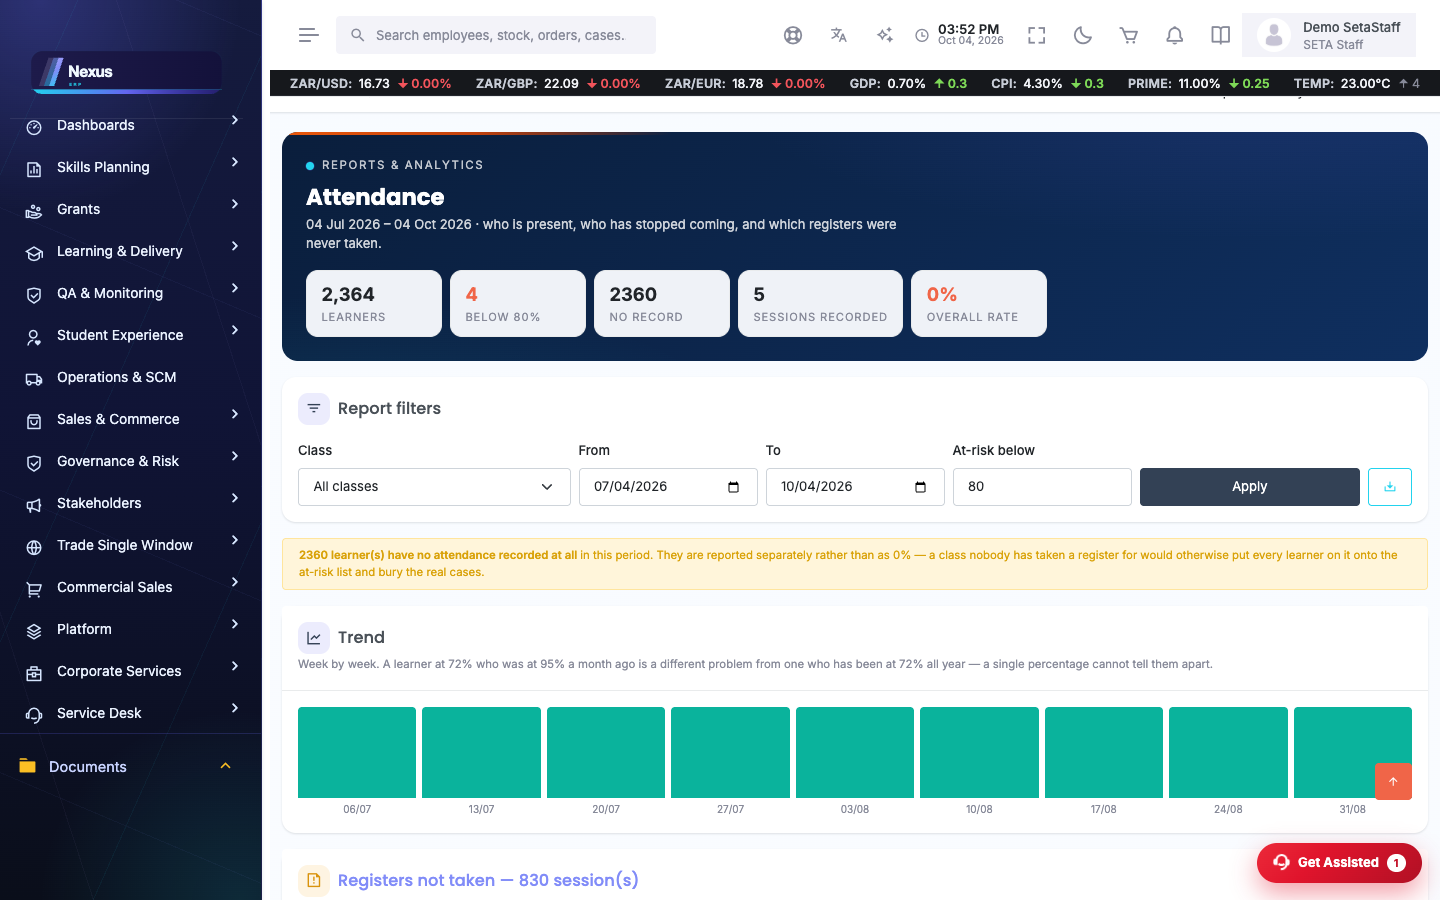
/Reports/AttendanceReport/AttendanceReportOverviewAttendance for a period: overall rate, below-threshold count, learners with no record, consecutive absences, registers not taken, by class and by learner.
- Set the period and filters, then Apply.
- Open a day's register from the modal to see who was present.
- Export the report to CSV for circulation.
Analytics
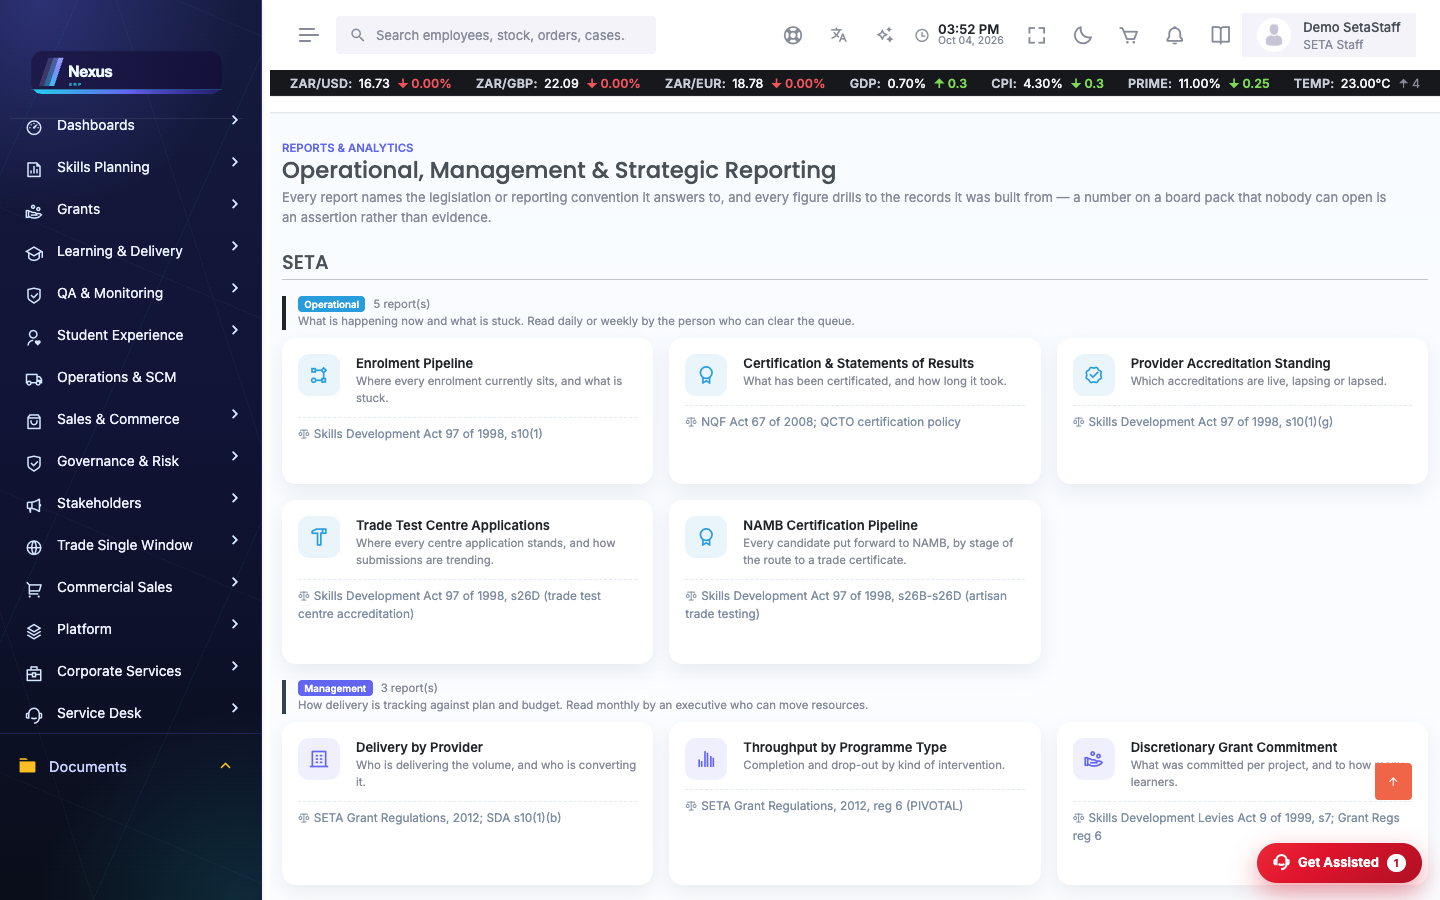
/Reports/Analytics/IndexA drillable report workbench over the operational data.
- Pick a report.
- Drill into any figure to the underlying rows.
APP targets — Annual Performance Plan
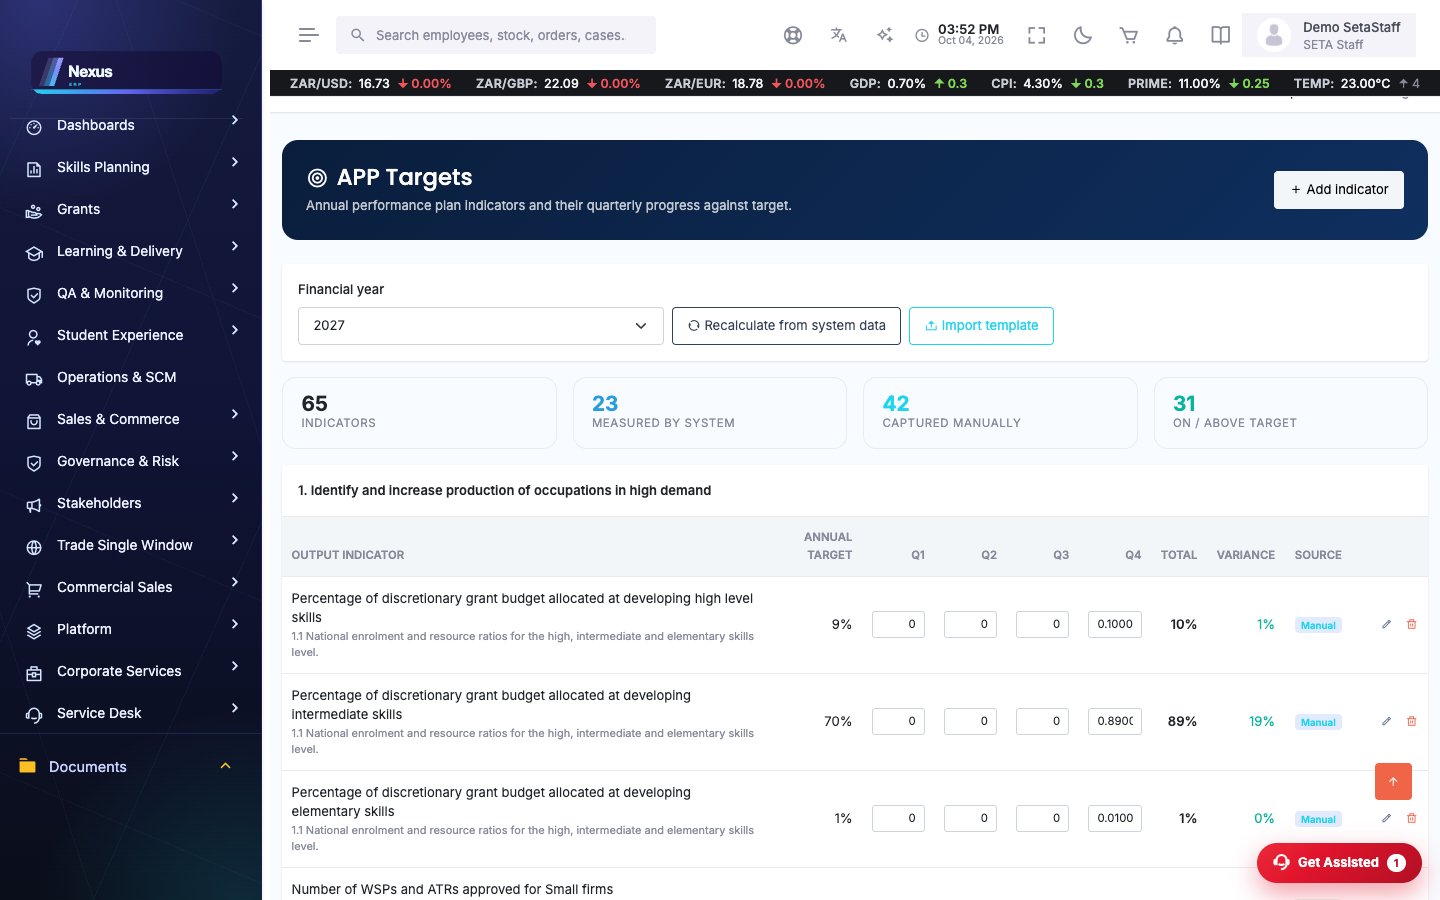
/Reports/AppTargets/AppTargetsOverviewThe year's NSDP outcomes, sub-outcomes and output indicators with their APP/SLA annual target and quarterly target, set against what the system actually holds. Import the targets from the SETA quarterly reporting template, then let each indicator that can be measured from live data fill its own actuals; the rest are captured by hand.
- Choose the financial year at the top of the screen — every figure narrows to it.
- Import template — upload the SETA quarterly reporting workbook. Its 00_Summary sheet is read: outcome, sub-outcome, output indicator, the annual APP/SLA target and the quarterly target. Indicators already captured for the year are updated, not duplicated.
- Leave Also import the Q1–Q4 figures ticked to load the quarterly actuals for the manually-measured indicators from the same sheet.
- Refresh recomputes the system-measured indicators from live data, so target-vs-actual and variance stay current.
- Add or edit any indicator the template does not carry directly on the screen.
FAQ & troubleshooting
Why do rates look low for a new class?
Days with no register taken count as unknown, and the report says so — take the registers and the rate corrects itself.