Dashboards & Analytics
Role-shaped landing dashboards and the monitoring-and-evaluation analytics view — the numbers first, one click from the work behind them.
🗺From sign-in to insight
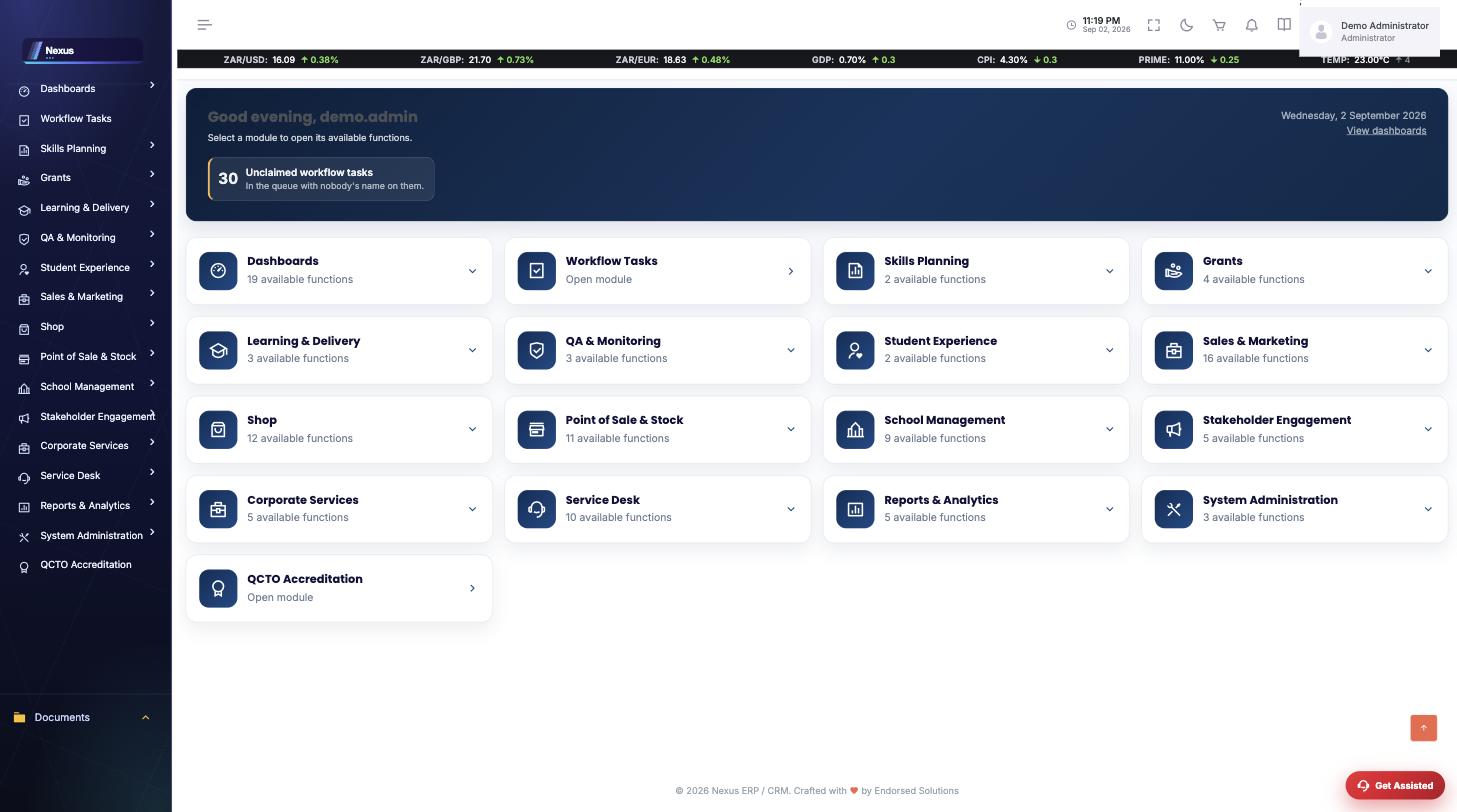
How the module fits together end to end. Colours mark who acts: navy = staff/admin, cyan = external user, green = organisation, orange = the system.
🧭1. Sign-in to Insight Process
From the module launcher to the number behind the number.
📈Role & module dashboards
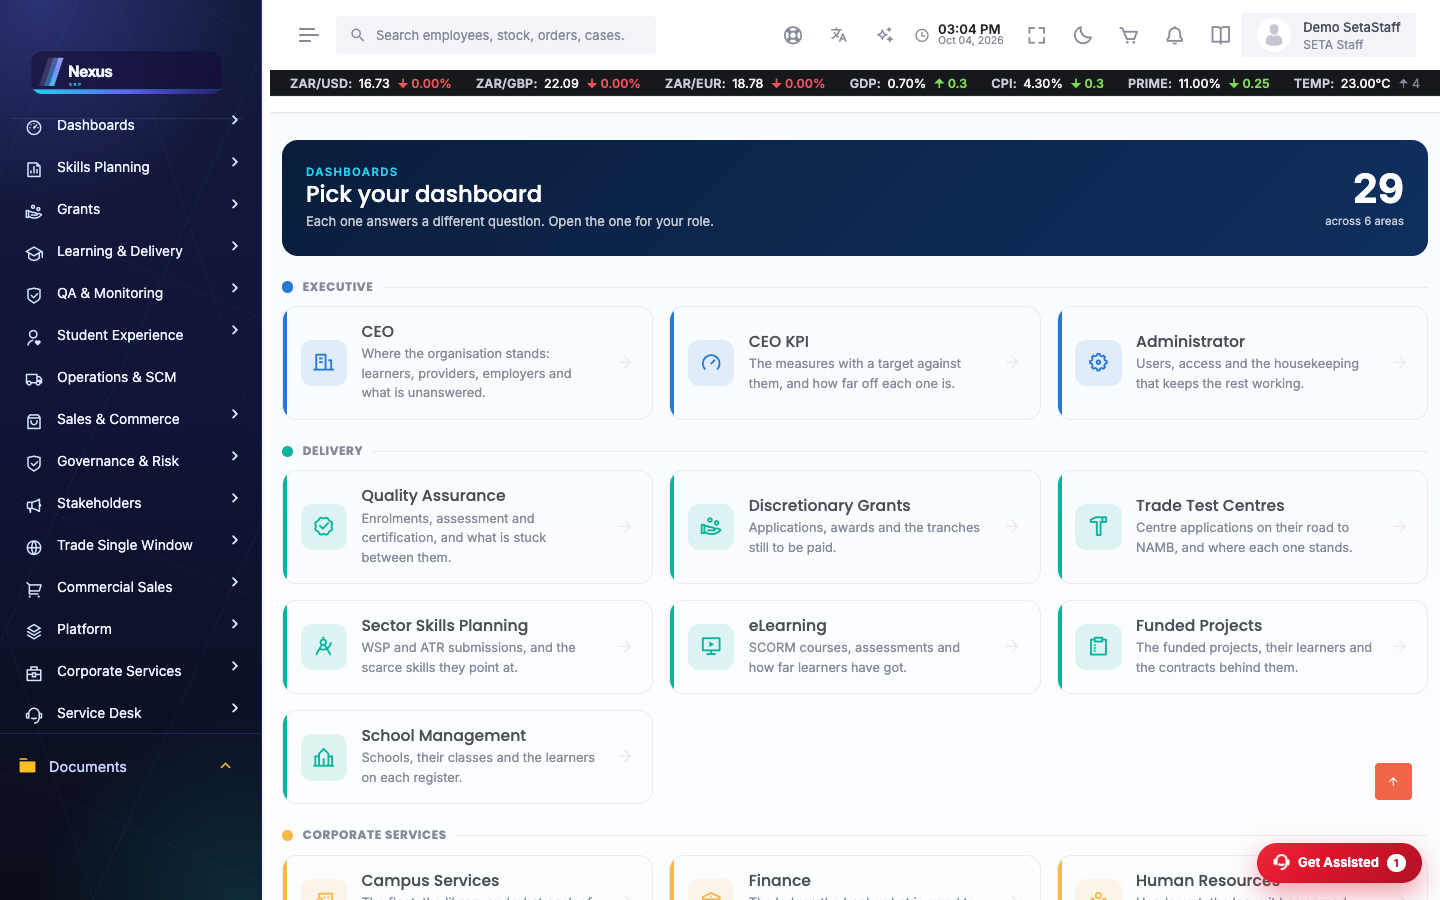
Dashboard gallery /Dashboards/RoleDashboard/Index
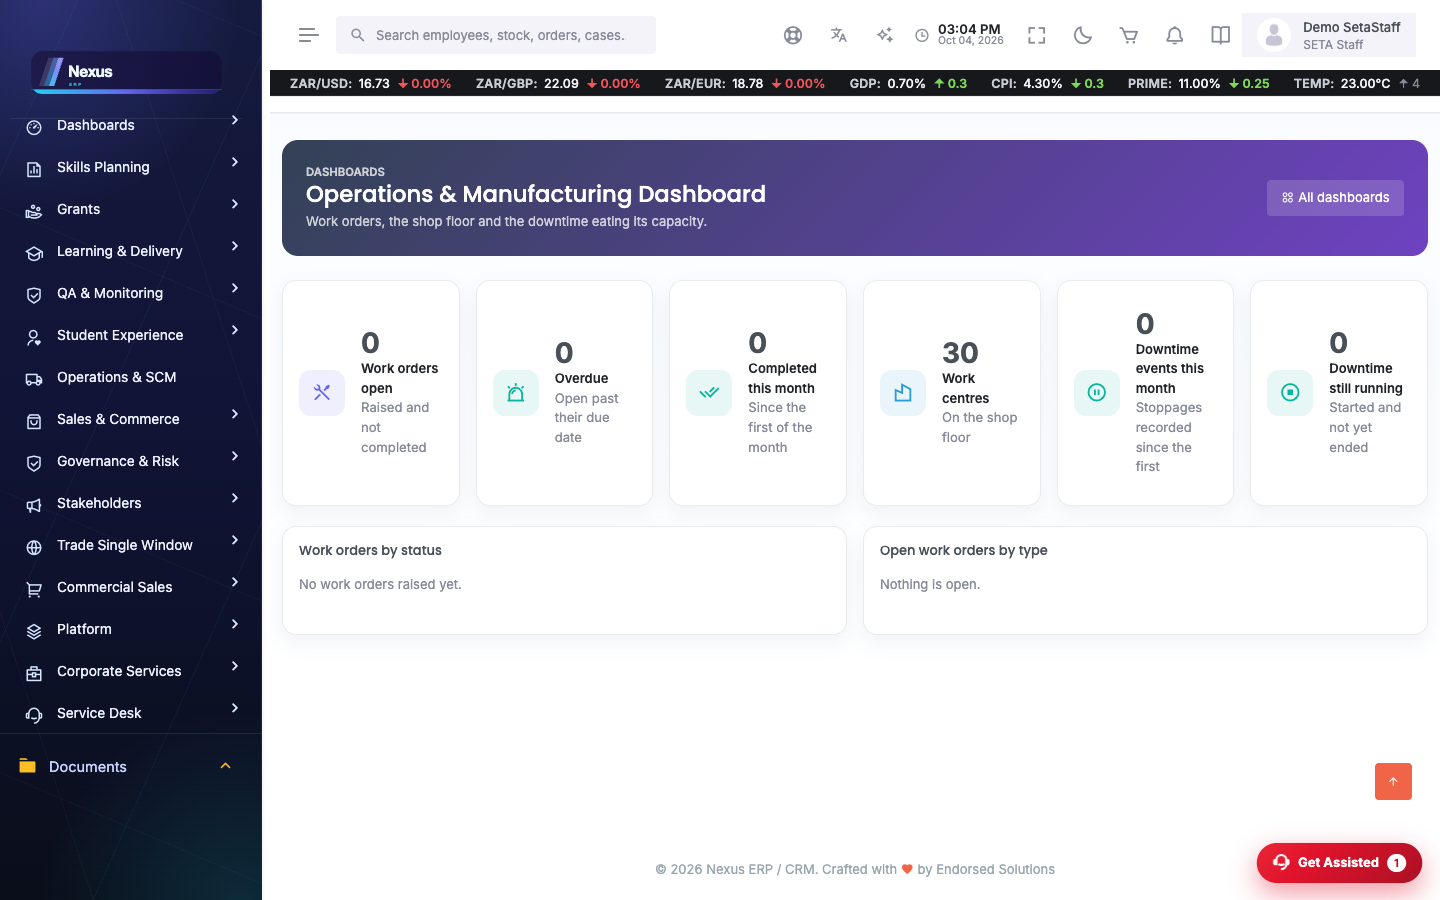
The gallery opens onto 29 dashboards, each built live from the operational tables — nothing is cached or seeded, and a figure that is genuinely zero shows as zero. Every tile carries a headline number, most open the register behind them, and each one also lists what is waiting on a decision. Pick the one for your role or the module you are working in:
- Executive — CEO, CEO KPI, Administrator.
- Delivery — Quality Assurance, Discretionary Grants, Trade Test Centres, Sector Skills Planning, eLearning, Funded Projects, School Management.
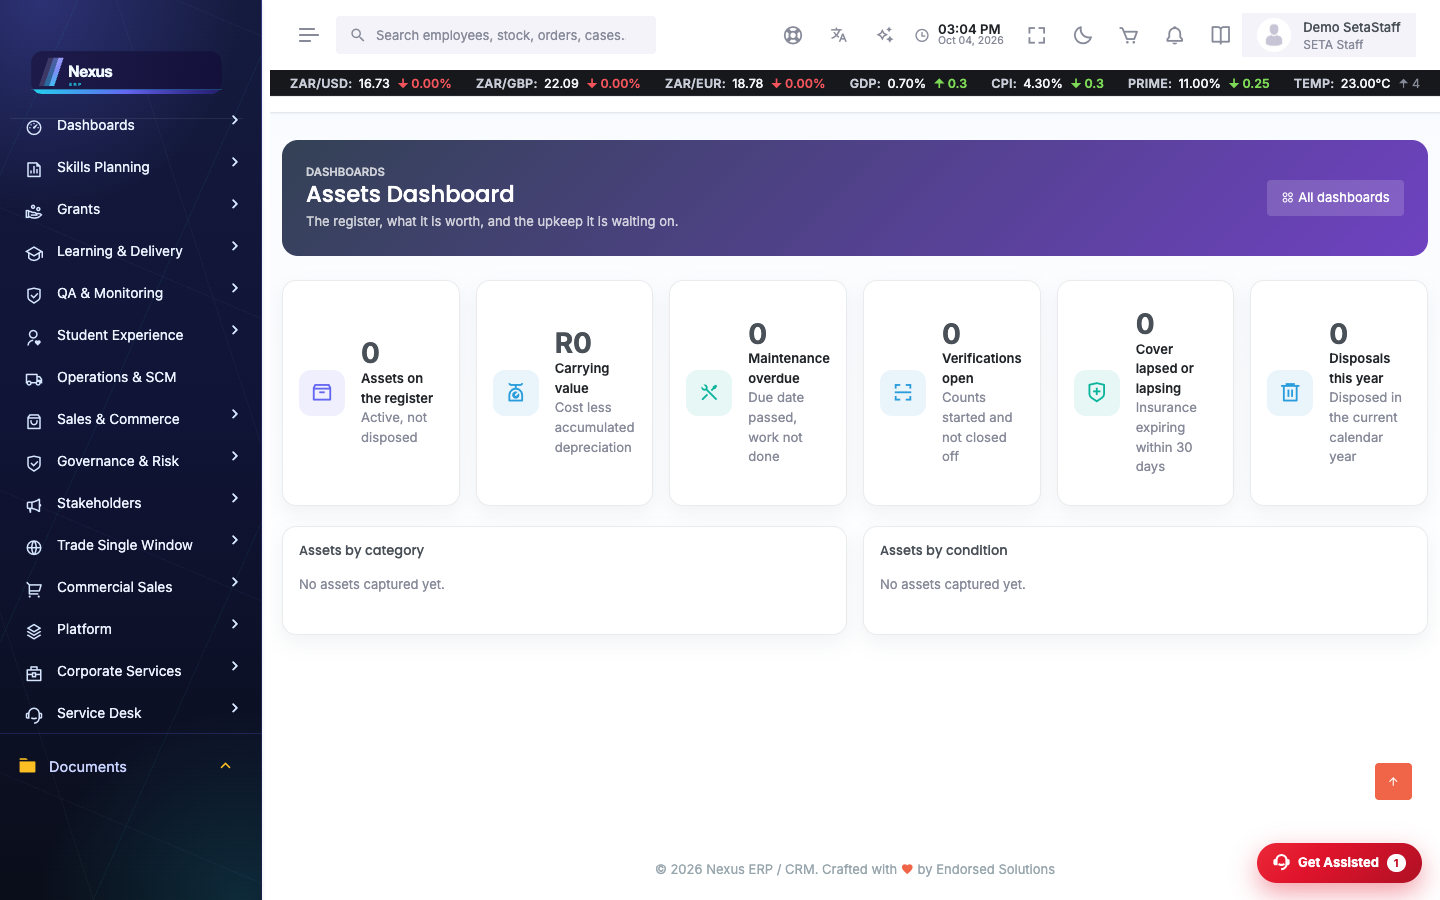
- Corporate services — Finance, Human Resources, Procurement, Campus Services, Assets, Inventory & Stock, Travel, Service Desk, Operations & Manufacturing.
- Governance & risk — Governance & Risk, Access Control.
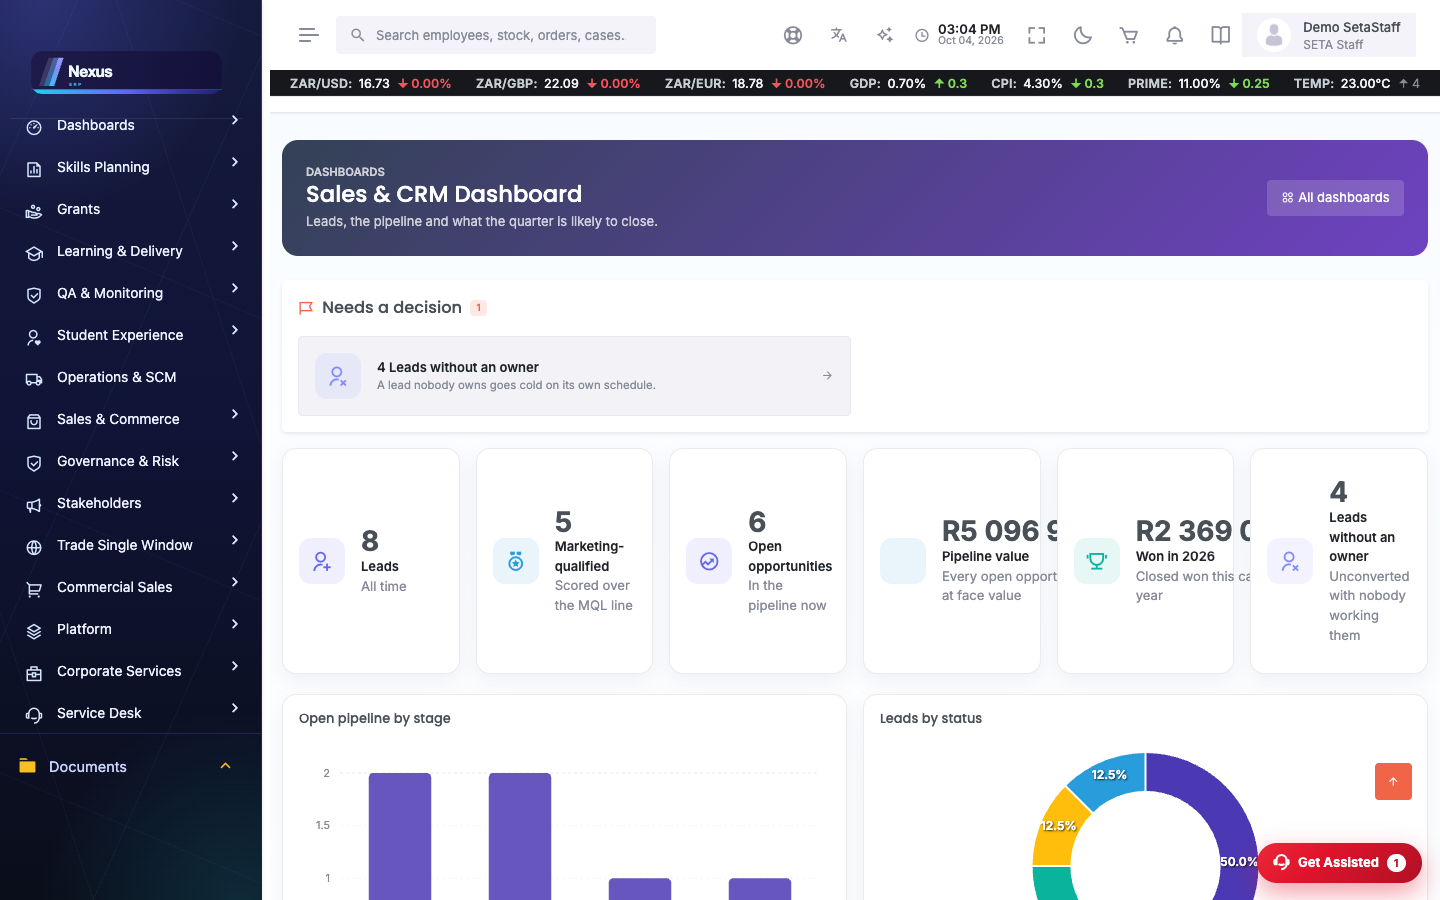
- Commerce — Sales & CRM, Shop & Point of Sale.
- Stakeholders — Skills Development Provider, Assessor, Moderator, Learner, Employer, Sector Skills Agent.
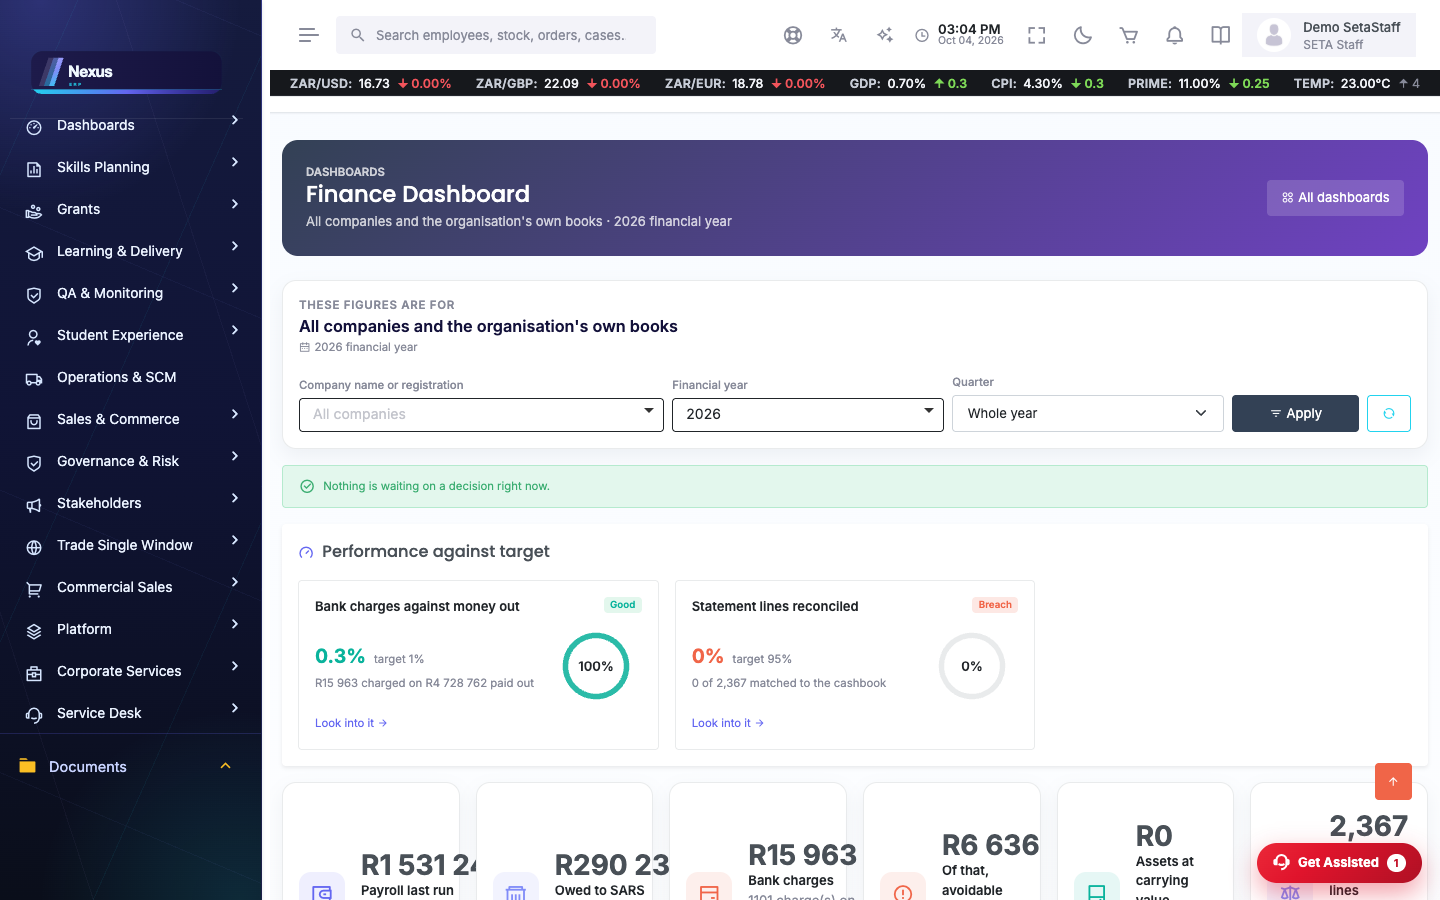
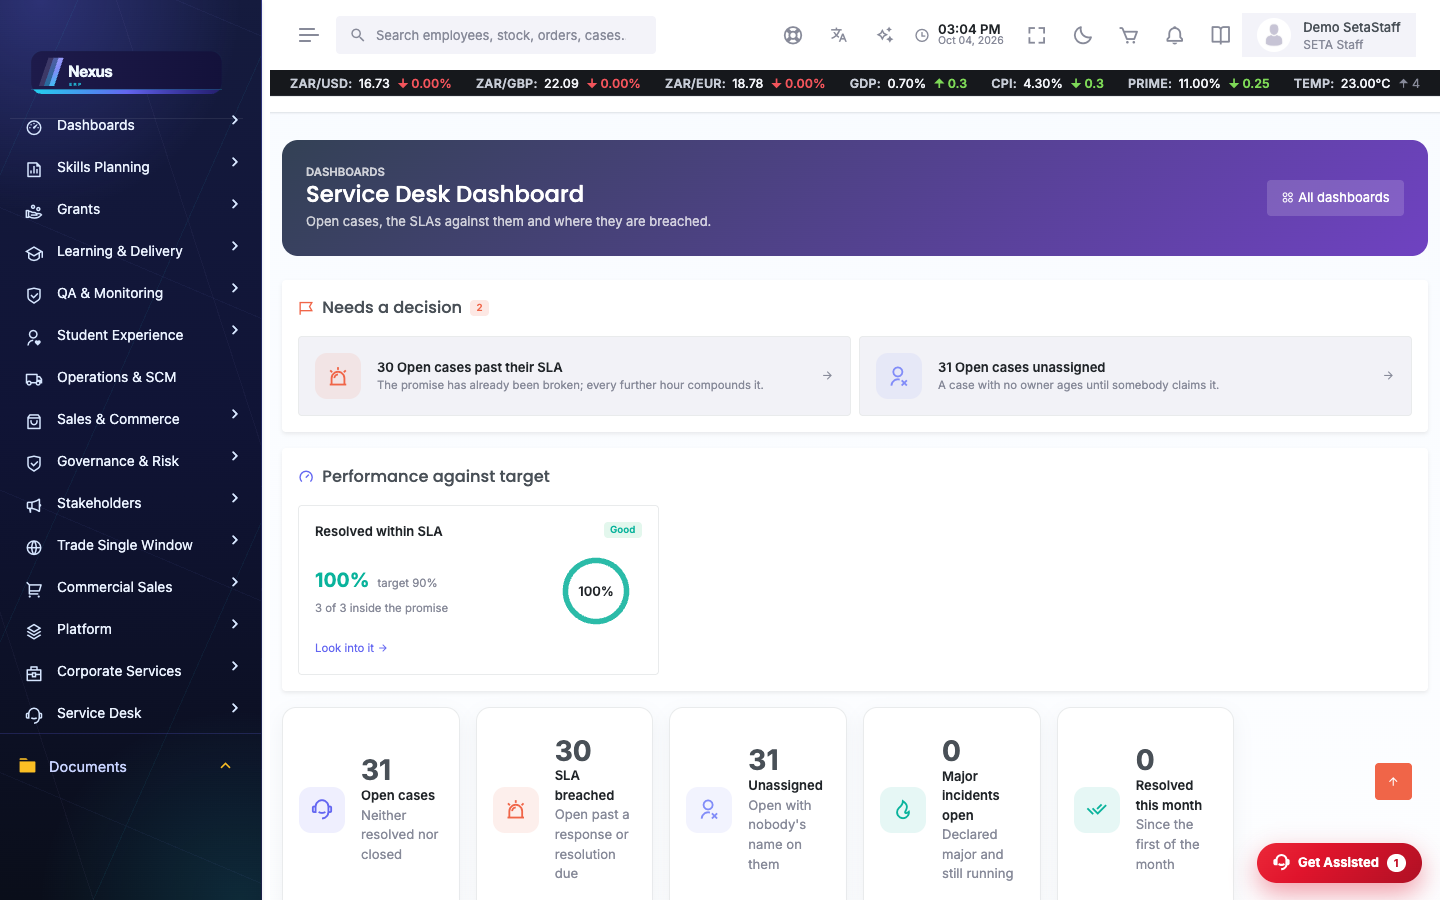
Each opens at /Dashboards/RoleDashboard/<Name> — for example /Dashboards/RoleDashboard/Finance or /Dashboards/RoleDashboard/ServiceDesk. You do not need to know your own name: /Dashboards/RoleDashboard/Dashboard always opens the dashboard your user type is configured to land on (set on the user type as its landing dashboard), and falls back to this gallery when none is set. The Finance dashboard also takes a financial year, quarter and company so its figures narrow to the period you report on.
A few of the module dashboards, for reference:
📊Monitoring & evaluation analytics
M&E Dashboard /Dashboards/MnE/MnEDashboard
Programme performance across funded projects: targets vs actuals, site-visit outcomes, spend.
- Filter by period or programme.
- Drill into a project to reach its M&E records.
❓FAQ & troubleshooting
Why does my dashboard differ from a colleague's?
Dashboards are role-shaped — an administrator, a provider and a learner each get their own layout.
Numbers look stale.
Most tiles read live; a hard refresh (Cmd/Ctrl+Shift+R) rules out browser caching.